Financial analysis:
Organizations participating within the Patient and Family Support field of non-profits, like many other fields, quite heavily rely upon donations for significant proportions of their total revenue. This reliance, particularly for those ‘wish granting organizations’, is due to how many of these organizations, as mentioned before, act almost as intermediaries between those donating and patients receiving the service. This reliance on donations present within the industry becomes evident as we look to Figure 1. It is through looking at the average Contributions (CONT) in the sample compared to the average Total Revenue (TOTREV) that we can see just how much these organizations revenue is made up by the Contributions that they receive. This point is illustrated further by us then looking at Program Service Revenue (PROGREV) and again comparing it to Total Revenue.
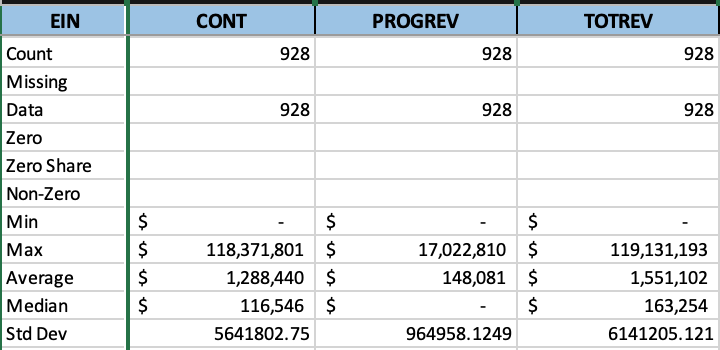
It should be said that in this table the larger organizations have been separated into their different chapters according to their location.
Benchmarking:
As mentioned in previous sections benchmarking is an incredibly valuable tool in the determining of the effectiveness of a company in the carrying out of their logic model compared to other companies existing in the industry.
To demonstrate just how benchmarking can be used to better understand an organization and how it is operating, we will use the example of the Make-a-Wish foundation and compare it to the industry average as well as one of their ‘competitors’, the Dream Factory.
In Figure 2 we see a comparison in the ‘chapter’ average total revenue for the Make-a-Wish Foundation, Dream Factory and finally the industry average. This graph helps to illustrate differences in size between these organizations. As is obvious, by looking at the graph, the Make-a-Wish Foundation has a considerably larger level of revenue than the industry average and Dream Factory.
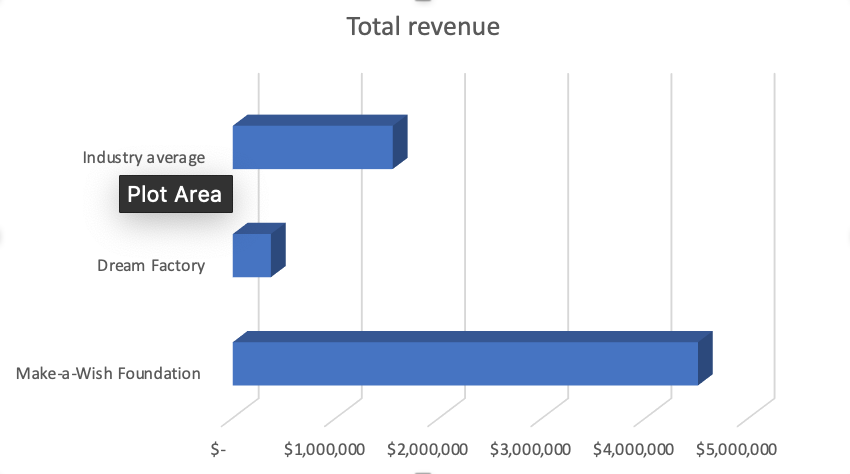
Analyzing these companies through this financial lens however begins to get interesting when we look more specifically at the Make-a-Wish Foundation and Dream Factory and compare the percentage of revenue that goes towards program services in combination with the number of dreams that each of the organizations is granting annually. This information is presented in Figures 3 and 4. These graphs, unlike the previous two, are however based on the ‘parent’ organization rather than the smaller chapters that make it up.
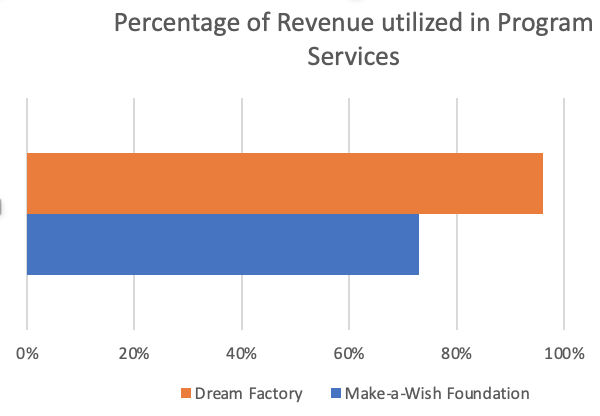
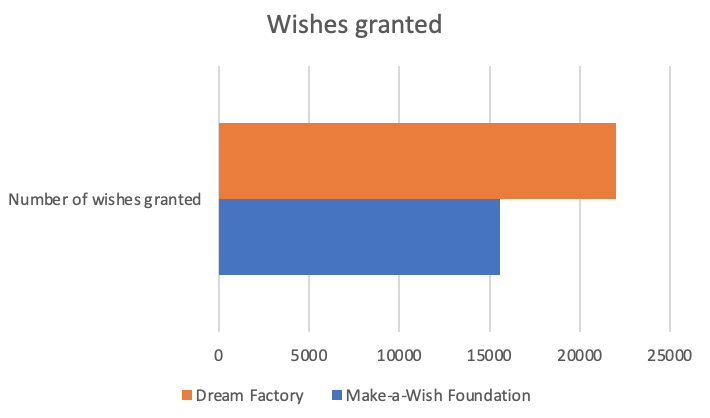
It is this set of graphs (2,3 & 4) that we can begin to visualize the question that lies at the heart of this investigation. As if this were a traditional business or even many other types of non-profits the significant difference between the organizations in total revenue should have been a good indicator of the potential that these two businesses had in achieving their theory of change and carrying out their logic models. This however is not the case as we see that despite the Make-a-Wish Foundation having much higher levels of total revenue, the Dream Factory is far more efficient in achieving their goals of maximizing the number of children they can help.
